
 AI SMM team
TikTok analytics tells you three things a small business actually needs to know: whether people watch your videos to the end, where those viewers come from, and whether watching turns into followers, profile visits and clicks. This TikTok analytics guide shows where to find the numbers, which five or six of them deserve your attention, how to judge a single video, and how to turn a 20-minute weekly review into decisions about what to film next. Most accounts look at views and likes and stop there; the useful signals sit one screen deeper.
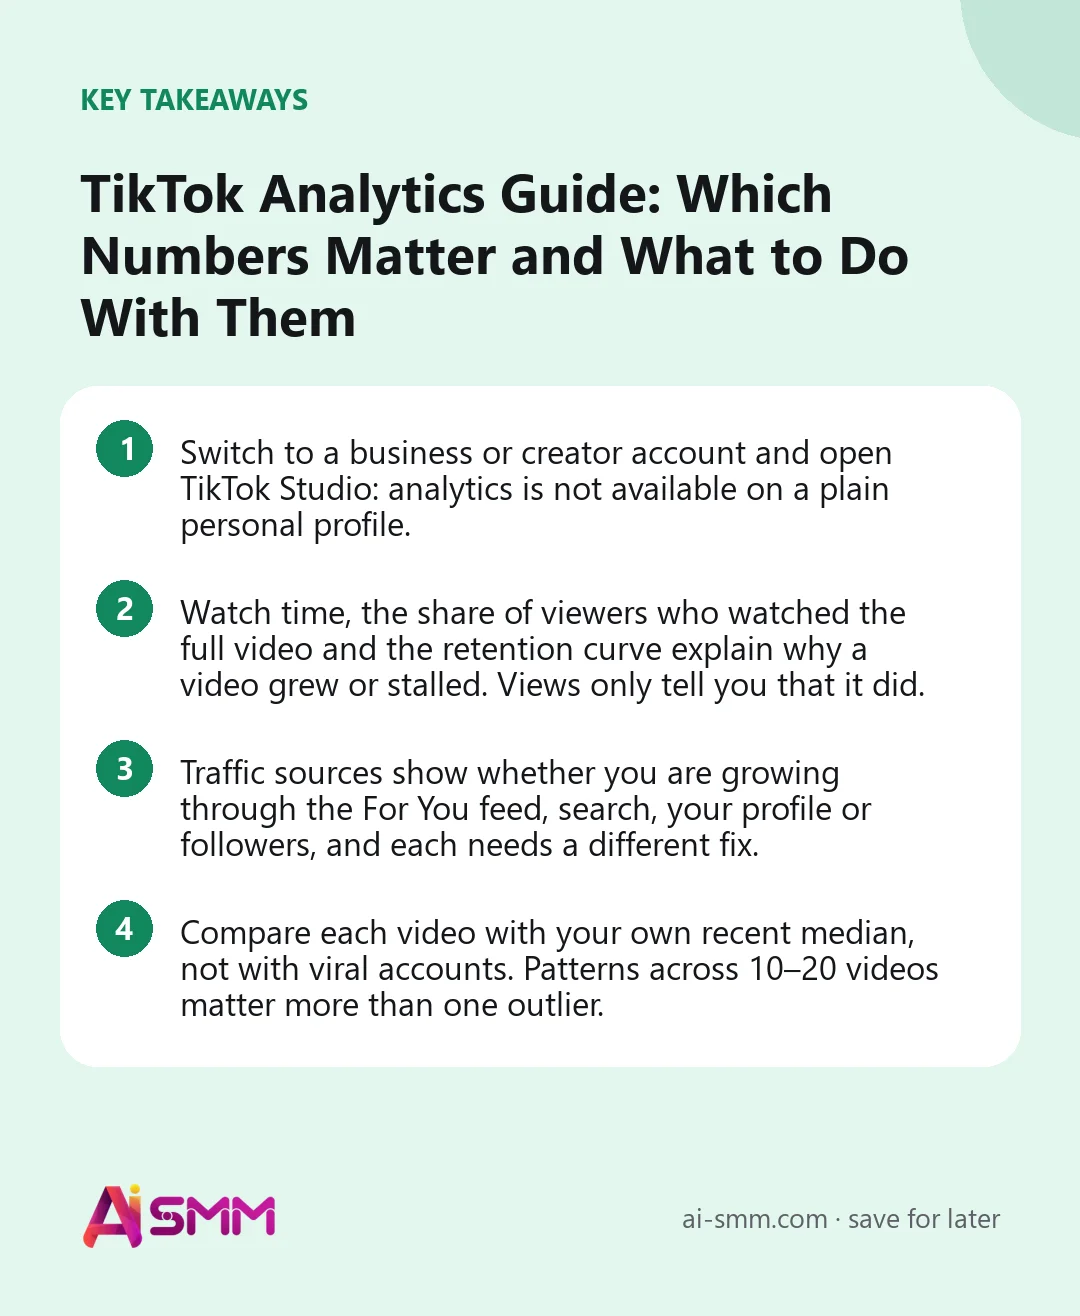
- Switch to a business or creator account and open TikTok Studio: analytics is not available on a plain personal profile.
- Watch time, the share of viewers who watched the full video and the retention curve explain why a video grew or stalled. Views only tell you that it did.
- Traffic sources show whether you are growing through the For You feed, search, your profile or followers, and each needs a different fix.
- Compare each video with your own recent median, not with viral accounts. Patterns across 10–20 videos matter more than one outlier.
How to open TikTok analytics
Analytics is available for business and creator accounts. If you still have a personal account, switch it in the account settings; it is free and takes a minute. Then:
- On your phone, open your profile, tap the menu and choose TikTok Studio (older versions call it Creator tools or Business suite), then Analytics.
- On a computer, open TikTok in the browser, log in and go to TikTok Studio, where analytics is easier to read on a big screen.
- Choose a period. Short periods like 7 days show recent changes; 28 or 60 days show the pattern.
- For a single video, open the video and tap the analytics or “more data” option under it.
Data usually appears within a day and only for the time after you switched to a business or creator account, so switch early even if you are not ready to analyse anything yet. Menu names change often; if something is not where this guide says, look for the same words inside TikTok Studio.
The main sections of TikTok analytics
| Section | What it shows | Question it answers |
|---|---|---|
| Overview | Video views, profile views, likes, comments, shares, net followers for the period | Is the account growing or flat? |
| Content | Every video with its views and engagement; per-video details | Which videos worked and which did not? |
| Viewers / Followers | Gender, age, top locations, when followers are active | Are these the right people, and when are they online? |
| Per-video analytics | Watch time, full-video rate, retention curve, traffic sources, search terms | Why did this particular video grow or stall? |
| LIVE | Stats for live streams, if you run them | Is live worth the time? |
TikTok analytics metrics that actually matter
You can ignore half of what TikTok shows and lose nothing. These are the numbers that lead to decisions.
1. Average watch time
How long, on average, one view lasted. Compare it with the length of the video: 9 seconds on a 12-second video is excellent, 9 seconds on a 60-second video means most people left early. This is the clearest sign of whether the content held attention.
2. Watched full video
The share of viewers who reached the end. It is one of the strongest signals TikTok uses to widen distribution, and it is also where shorter videos have an easier time. If this number is low across the board, tighten your edits before changing anything else.
3. Retention curve
The graph of how many viewers are still watching at each second. A steep drop in the first 1–3 seconds means the hook failed. A drop in the middle points to a slow part, a repeated point or a long pause. A bump means people rewatched something, which tells you what they found interesting.
4. Traffic sources
Where views came from: For You, Following, your profile, search, sound pages and others. A healthy business account usually gets most views from For You, a growing share from search, and a steady share from the profile.
5. Shares and saves
People share what they want someone else to see and save what they want to come back to. Both signal real value, and both are closer to buying intent than likes. A how-to that gets saved is a candidate for a series.
6. New followers and profile views per video
A video can reach many people and bring no one to your profile. When a video drives profile views and followers, it means viewers wanted more from you specifically, which is the step before a booking or an order.
Engagement rate: how to calculate and read it
Engagement rate (ER) puts reactions in relation to reach, which makes small and large videos comparable. The simple version for TikTok:
ER by views = (likes + comments + shares + saves) ÷ views × 100%
Some tools calculate ER by followers instead of views. For TikTok, where most views come from people who do not follow you, ER by views is usually more useful. Whichever formula you pick, use the same one every time.
| ER by views | How to read it (in our experience, small accounts) |
|---|---|
| Below 2% | Views without interest: topic or hook attracted the wrong audience |
| 2–5% | Normal range for most business content |
| 5–10% | Strong: the audience cares, worth repeating the format |
| Above 10% | Exceptional, often a video that hit a real pain point or sparked discussion |
Treat these as rough orientation, not targets. Your own median over the last 20 videos is the benchmark that matters.
What your traffic sources are telling you
| Mostly from… | What it means | What to do |
|---|---|---|
| For You | TikTok is testing you with new audiences | Keep hooks sharp and topics clear; this is where growth comes from |
| Following | Only existing followers watch | Broaden the topic or the hook so it makes sense to someone who does not know you |
| Search | People find the video by a query | Make more answers to similar questions; note the search terms in video analytics |
| Profile | Visitors browse your older videos | Pin your best three videos and check your bio and link |
| Sound | Views come via a trending sound | Good for reach, but check whether these viewers follow or just pass by |
If a video shows search terms, write them down. They are real phrases people typed, and each one can become the topic of a new video.
How to judge a single video in two minutes
Open the video’s analytics 48–72 hours after posting and go through this checklist:
- Views versus your median. Above or below your typical video?
- Retention in the first 3 seconds. If more than half of viewers left, the opening is the problem.
- Full-video rate and average watch time. Did people stay? Where exactly did they leave?
- Shares and saves. Did the video give people something worth keeping or sending?
- Followers and profile views. Did the video make people curious about you?
- Traffic sources and search terms. Who found it, and how?
Then write one sentence: “Keep…”, “Change…” or “Drop…”. That sentence is the whole point of the exercise.
Audience data: are you reaching customers or just viewers?
The Viewers or Followers section shows age, gender, top countries or cities, and when followers are active. For a local business this is a reality check. Say a dental clinic in Vilnius has 60% of followers in another country because one video went viral abroad. The account looks healthy, but those followers will never book a check-up. In that case, bring local signals back into your videos: say the city, show the street, answer questions local people ask. The activity chart, meanwhile, helps you pick posting times, and our guide to the best time to post on TikTok explains how to test them.
A 20-minute weekly TikTok analytics review
Put it in your calendar on the same day each week. A simple routine beats an occasional deep dive.
- Minutes 1–5: overview for the last 7 days versus the previous 7. Views, profile views, net followers. Up, flat or down?
- Minutes 5–12: sort videos from the week. Look at the best and the worst one: retention curve, traffic sources, shares and saves.
- Minutes 12–17: note search terms and repeated questions in comments. Add them to your content ideas list.
- Minutes 17–20: write three decisions for next week: one format to repeat, one thing to change in editing, one new topic to test.
| Week | Views | Profile views | Net followers | Best video and why | Decision for next week |
|---|---|---|---|---|---|
| Week 1 | |||||
| Week 2 |
Common mistakes when reading TikTok analytics
- Chasing views alone. A video with 50,000 views and no profile visits did less for the business than one with 3,000 views and ten booking questions.
- Judging after two hours. Many videos pick up for days. Look at 48–72 hours for a first read and a week for a final one.
- Learning from one viral hit. A single outlier is often luck. Look for patterns across several videos before changing strategy.
- Changing five things at once. If you change the hook, length, topic and posting time together, you will not know what worked.
- Ignoring the business side. TikTok cannot see phone calls, DMs on other networks or walk-ins. Ask new customers where they found you and count it.
TikTok analytics in AI SMM
TikTok Studio is the place for deep, per-video diagnosis: retention curves, traffic sources, search terms. What it does not do is show TikTok next to the rest of your marketing. AI SMM analytics (Pulse) brings TikTok into the same screen as Instagram, YouTube, Threads and other connected networks, with views, likes, followers and engagement rate per video, so you can see whether a clip that worked on TikTok also worked as a Reel. An AI hint on each tab explains what changed and what to try next, and reports can be exported for a client or a partner.
The decisions then turn into content in the same place. If a tutorial format wins, AI Content Studio drafts captions for the next few in your brand’s tone, video clipping cuts more clips from your longer recordings, and the content calendar schedules them. TikTok comments are not part of the AI SMM inbox, so questions from comments are still collected in the TikTok app.
FAQ
Why can’t I see analytics on my TikTok account?
Analytics is available for business and creator accounts. Switch the account type in settings, then give TikTok about a day to start collecting data. Data from before the switch will not appear.
How far back does TikTok analytics go?
TikTok offers preset periods such as the last 7, 28 and 60 days, and on many accounts a custom range. For longer history, note key numbers in a weekly table or use a tool that stores them.
Which is the most important TikTok metric?
For growth, watch time and the share of viewers who watched the full video. For business results, profile views and new followers per video, because they show that viewers wanted more from you.
Can I see who viewed my TikTok videos?
Analytics shows aggregated data, such as age, gender and location, not a list of individual viewers of your videos. Profile view history, where available, only shows people who have the same setting turned on.
Pick one day a week, spend 20 minutes on the review above and leave with three decisions. To see TikTok next to all your other networks and get an AI hint on what to do next, try analytics in AI SMM.
Posts, chats, video and sales in one workspace. 7 days free.
Start free