
 AI SMM team
Instagram gives you dozens of numbers, and most small business owners look at two of them (followers and likes) and then close the app, none the wiser. This Instagram analytics guide takes the opposite approach: a short list of metrics that actually answer business questions, what each one tells you, and the specific action to take when it goes up or down. The goal is not a prettier report; it is knowing what to post next week.
Everything below works with Instagram’s own statistics in a professional account and with any analytics tool. At the end we show how the same check looks in AI SMM, where Instagram sits on one screen with your other networks.
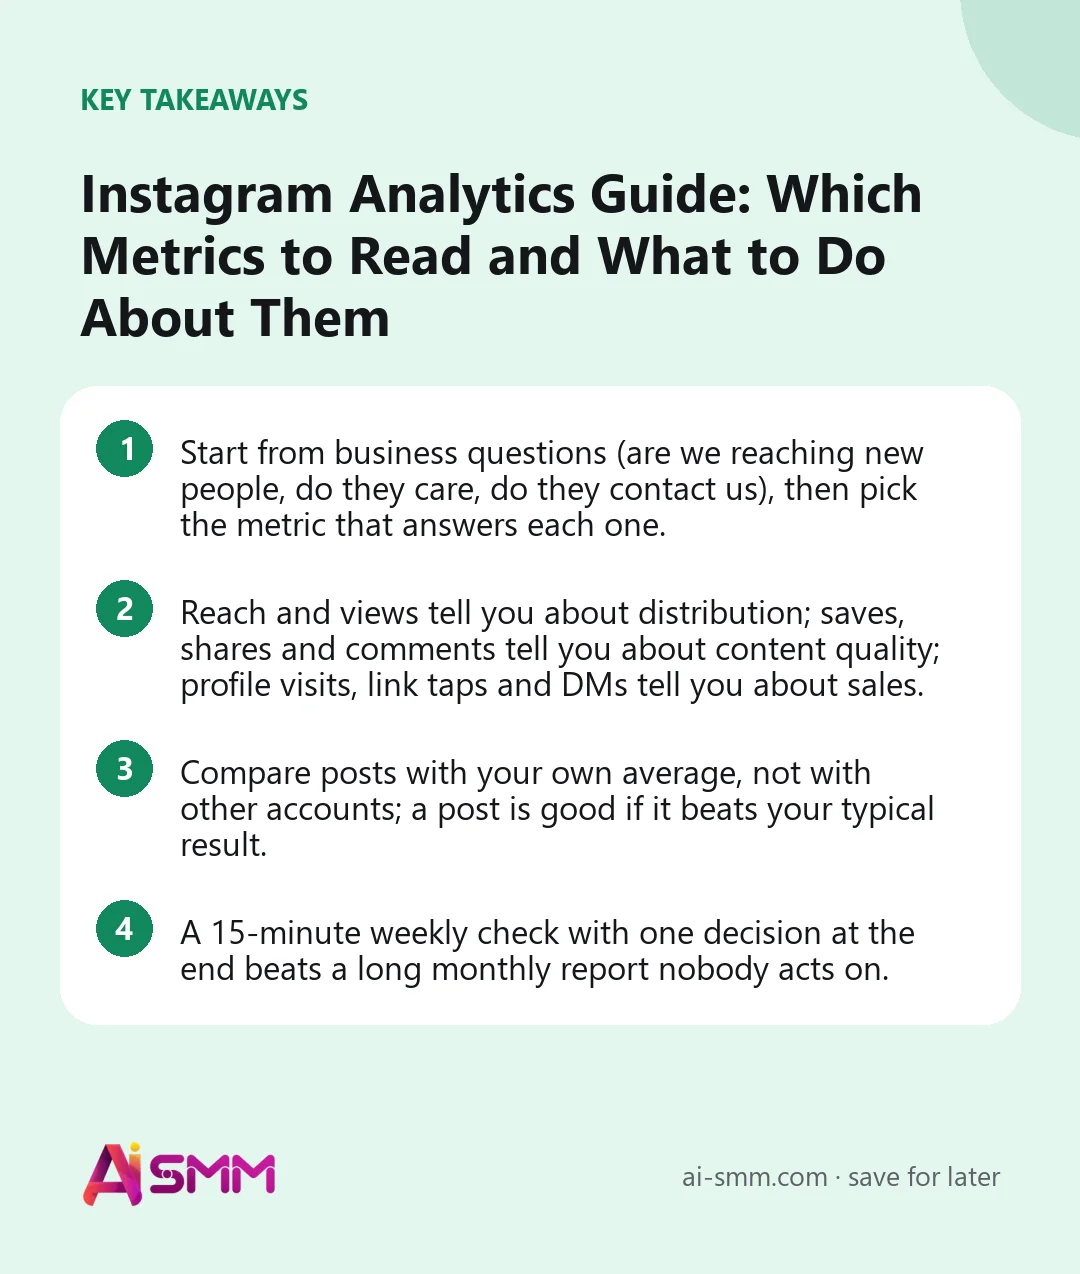
- Start from business questions (are we reaching new people, do they care, do they contact us), then pick the metric that answers each one.
- Reach and views tell you about distribution; saves, shares and comments tell you about content quality; profile visits, link taps and DMs tell you about sales.
- Compare posts with your own average, not with other accounts; a post is good if it beats your typical result.
- A 15-minute weekly check with one decision at the end beats a long monthly report nobody acts on.
Where to find Instagram analytics
Instagram shows statistics only for professional accounts (business or creator). Switching is free in the account settings. After that you get:
- Account overview in the professional dashboard: views, accounts reached, interactions, follower growth for a chosen period.
- Post and Reel statistics under each publication (“View insights”): views, reach, likes, comments, saves, shares, profile activity.
- Story statistics while a story is live and in the archive: views, replies, taps forward and back, exits, link taps.
- Audience: follower location, age ranges, gender and the hours and days when followers are most active.
Instagram renames metrics from time to time (for example, it has moved towards “views” as a main metric across formats). The ideas below stay the same even when the labels change.
The metrics that matter: what to read and what to do
| Business question | Metric | If it drops | If it grows |
|---|---|---|---|
| Are we reaching people? | Reach, views | Post more Reels, check posting times, refresh hooks | Find the common trait of top posts and repeat it |
| Are we reaching new people? | Share of reach from non-followers | More Reels and collabs, fewer “insider” posts | Make sure the profile converts newcomers (bio, highlights) |
| Does the content matter to them? | Saves, shares | Add practical value: tips, checklists, prices | Turn the topic into a series |
| Does it start conversations? | Comments, story replies | Ask direct questions, use polls | Answer fast; move conversations to DM |
| Does it lead to business? | Profile visits, link taps, DMs | Clear call to action, better bio and link | Check the landing page and response speed |
| Is the audience growing? | Follows, unfollows | Check what changed: topic, frequency, tone | Note which posts brought follows |
Likes are missing from this table on purpose. They are a useful quick signal, but they are the cheapest interaction and say little about whether someone will buy.
How to calculate engagement rate on Instagram
Engagement rate shows what share of the people who saw a post interacted with it. For small accounts, the most useful version is calculated by reach:
Engagement rate (by reach) = (likes + comments + saves + shares) ÷ reach × 100%
Say a carousel reached 1,200 accounts and got 70 likes, 8 comments, 25 saves and 9 shares: (70 + 8 + 25 + 9) ÷ 1,200 × 100% ≈ 9.3%.
What counts as “good” depends on the niche, account size and format, and published benchmarks vary widely. A more reliable approach: calculate the rate for your last 20–30 posts, take the average, and judge each new post against that. A post 1.5 times above your own average is a winner worth repeating; one consistently below it is a format to rethink.
Reading analytics by format
Reels
Reels are your main tool for reaching people who do not follow you yet. Look at views and reach, the share of non-followers, and watch time or how many people watched to the end where available. If views are high but watch time is short, the hook works and the middle does not: cut the video tighter. If views are low from the start, the first second and the cover are the problem.
Carousels
Carousels live on saves and shares. A carousel with many saves is a sign the topic is useful; turn it into a series or a Reel. If people rarely swipe past the first slides, the first slide promises more than the rest delivers, or the text is too dense.
Single photo and video posts
Good for announcements, products and atmosphere. Judge them by comments and profile visits rather than reach: their job is often to convert people who already follow you.
Stories
Stories work with followers. Watch the drop-off between the first and last frame of a sequence, replies, and link taps. A sharp drop at one frame means that frame is boring or unclear. Many exits on the first frame usually mean the sequence started without a reason to watch.
Audience analytics: who they are and when they are online
The audience section answers two practical questions.
- Are these the right people? A local cafe with most followers from other countries has a reach problem that likes will not reveal. Check the top cities: they should match where you sell or deliver.
- When should we post? The chart of active hours and days shows when your followers open the app. Use it as a starting point, then test two or three time slots for a few weeks and keep the ones where posts perform above your average.
Age and gender are useful for tone and offers: a studio whose audience turns out to be older than expected may need different visuals and fewer slang captions.
A 15-minute weekly Instagram analytics check
- Look at the week in total (3 min): reach, profile visits, new followers, compared with the previous week. Up, flat or down?
- Find the top and bottom post (5 min): sort by reach and by saves and shares. What does the best one have that the worst one lacks: format, topic, hook, time?
- Check conversations (3 min): how many DMs, comments with questions and link taps did the week bring? Were all answered?
- Check stories (2 min): which sequence lost the most viewers and at which frame?
- Write one decision (2 min): “Next week: two more carousels like the top one” or “Move Reels to 19:00”. One decision is enough.
From numbers to decisions: eight typical situations
| What you see | Likely reason | What to do |
|---|---|---|
| Reach fell, engagement rate stable | Fewer posts or fewer Reels | Restore posting frequency; add 1–2 Reels a week |
| Reach stable, saves and shares fell | Content became less useful | More practical posts: tips, prices, how-tos |
| High reach, few profile visits | Content entertains but does not connect to the offer | Mention the product or service and add a clear action |
| Many profile visits, few DMs or link taps | The profile does not convert | Rewrite the bio, fix highlights, check the link |
| Many DMs, few sales | Slow or unclear replies | Answer faster, prepare ready answers for common questions |
| Followers grow, engagement falls | New followers are not your audience | Check where they came from; stop giveaways that attract random people |
| Stories lose viewers after the first frame | No reason to keep watching | Start with a question or a promise; shorten the sequence |
| One post far above average | A topic or format that resonates | Repeat it in another format within two weeks |
Monthly review: questions for the owner
- Did Instagram bring more conversations and clients this month than last month?
- Which three posts brought the most profile visits, DMs or link taps, and what do they have in common?
- Which content type took the most time and brought the least result?
- How does our growth compare with two or three competitors over the same period?
- What is the one thing we change next month?
Common mistakes when reading Instagram analytics
- Judging a post after two hours. Reels in particular can keep gaining views for days. Compare posts after the same interval, for example seven days.
- Comparing different formats head to head. A Reel will usually out-reach a photo post, and a carousel will usually out-save a Reel. Compare each format with its own average.
- Chasing follower count. A thousand followers from a giveaway who never buy are worth less than a hundred locals who book. Watch profile visits, DMs and link taps alongside growth.
- Reading one week as a trend. Holidays, weather and news move numbers. Look for patterns over three to four weeks before changing strategy.
- Changing five things at once. If you change time, format, topic and caption style in the same week, you will not know what worked. Change one variable, measure, then the next.
- Ignoring the zero. Posts with no comments or no link taps at all are data too: they tell you which topics your audience does not care about.
Connecting Instagram numbers to sales
Instagram statistics stop at the profile: they show a link tap or a DM, not the purchase that follows. To see the whole path, add simple markers. Use a separate link for Instagram (for example, your link-in-bio page) so visits from Instagram are counted apart from other sources. Give Instagram followers their own promo code or keyword. Ask new clients “where did you hear about us?” and write the answer down. After a month you will know roughly how many clients Instagram brought, which is the number that justifies the time you spend on it.
Instagram analytics in AI SMM
Instagram’s own statistics show one account at a time and leave the conclusions to you. Analytics in AI SMM (“Pulse”) shows followers, reach, engagement per post and audience demographics for Instagram next to your other networks on one screen, for any period, with data updated automatically several times a day. Each tab (Home, Posts, Best time, Score, Benchmark, Competitors) comes with a short AI hint on what changed and what to try next, which is exactly the “one decision” step of the weekly check.
The Best time tab looks at when your own audience is active, and the Competitors tab puts competitor accounts’ growth and activity next to yours, so “they seem to post more” becomes a real comparison. When a post type clearly wins, recreate it in the AI content studio and place it on the content calendar. Agencies can switch between a per-account and a company view and export Pulse tabs to share with clients; more on that in our page for agencies.
FAQ
Do I need a business account to see Instagram analytics?
You need a professional account, which can be business or creator. Switching is free in the settings, and statistics start collecting from that moment; earlier data may not be available.
What is a good engagement rate on Instagram?
It depends on niche, account size and format, and public benchmarks disagree. The most useful benchmark is your own average over the last 20–30 posts: aim to beat it, and repeat the posts that do.
How often should I check Instagram analytics?
A short check once a week and a deeper review once a month. Checking daily mostly adds anxiety; single days fluctuate too much to guide decisions.
Why did my reach drop suddenly?
Common reasons are posting less often, fewer Reels, a change of topics or a seasonal dip in your audience’s activity. Compare the week with the previous ones by format before changing everything at once.
Pick the six metrics from the table, run the 15-minute check next Monday and write down one decision. If you want Instagram and your other networks on one screen with an AI hint on what to do next, connect your accounts to AI SMM analytics.
Posts, chats, video and sales in one workspace. 7 days free.
Start free