
 AI SMM team
YouTube analytics answers two questions for a business channel: do people choose to click your videos, and do they stay once they have? Almost every useful number in YouTube Studio belongs to one of these two: impressions click-through rate (CTR) for the first, average view duration and the retention graph for the second, with traffic sources showing where the clicks come from. This YouTube analytics guide explains where each number lives, what “good” looks like for a small channel, how Shorts are measured differently and how to turn a monthly review into the next three videos.
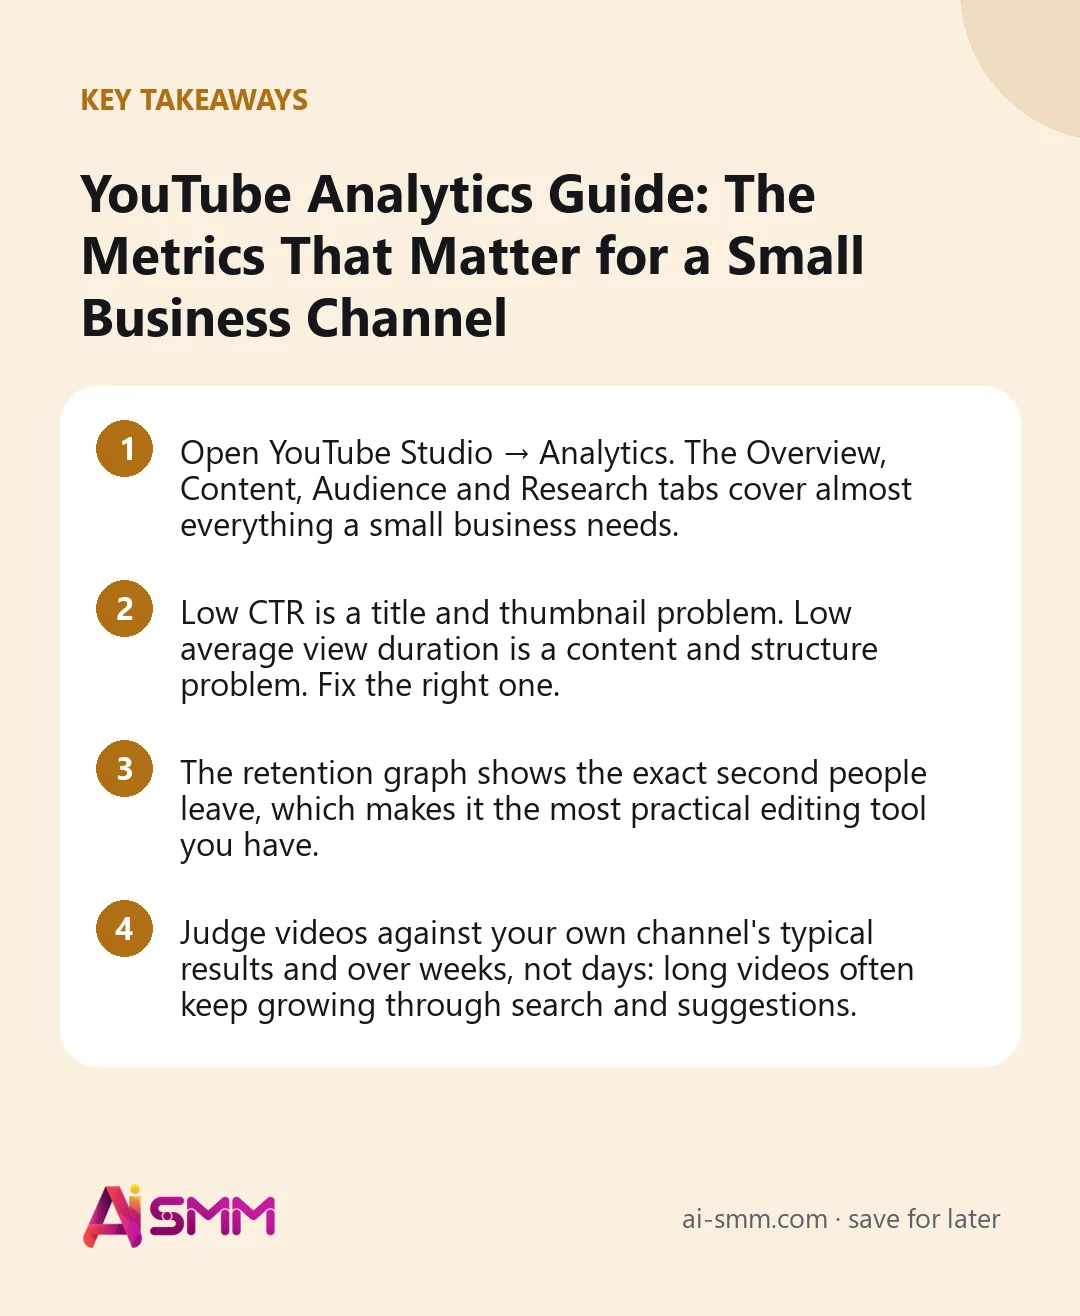
- Open YouTube Studio → Analytics. The Overview, Content, Audience and Research tabs cover almost everything a small business needs.
- Low CTR is a title and thumbnail problem. Low average view duration is a content and structure problem. Fix the right one.
- The retention graph shows the exact second people leave, which makes it the most practical editing tool you have.
- Judge videos against your own channel’s typical results and over weeks, not days: long videos often keep growing through search and suggestions.
Where to find YouTube analytics
- Go to YouTube Studio in a browser (or open the YouTube Studio app on your phone).
- Click Analytics in the left menu for the whole channel.
- For one video, open Content, hover over the video and click the analytics icon.
- Use Advanced mode (top right on desktop) to compare videos, periods and traffic sources in a table.
The main tabs you will use are Overview (views, watch time, subscribers and top content), Content (how viewers find and watch videos, with separate views for long videos, Shorts and live), Audience (who watches and when) and Research (what your audience and all viewers search for). If your channel earns money through the Partner Programme, you will also see Revenue.
The funnel behind YouTube analytics
It helps to read YouTube numbers as a funnel. Each step has one main metric and one typical fix.
| Step | Metric | If it is weak, look at |
|---|---|---|
| YouTube shows your video | Impressions | Topic demand, titles for search, consistency |
| Viewer chooses to click | Impressions CTR | Thumbnail and title |
| Viewer stays | Average view duration, average percentage viewed, retention graph | Opening, structure, pace |
| Viewer wants more | Subscribers gained, returning viewers, end-screen clicks | Series, playlists, calls to action |
| Viewer becomes a customer | Card and link clicks, enquiries you track yourself | Offer, description links, landing page |
YouTube analytics metrics that matter for business
Impressions and impressions CTR
Impressions count how often your thumbnail was shown on YouTube: on the home page, in search, in suggestions. CTR is the share of those impressions that turned into a view. As a rough orientation in our experience, many small business channels sit around 2–10%, with search traffic often higher than home page traffic. A sudden CTR drop on one video usually points to a weak thumbnail or a title that does not match what people searched.
Keep in mind that CTR often falls as a video reaches wider audiences, which is normal. A video with a lower CTR but many more impressions can be doing better overall.
Average view duration and average percentage viewed
How long people watch on average, in minutes and as a share of the video. For a 10-minute tutorial, holding 40–50% is solid; for a 3-minute product demo you want more. These numbers matter more than raw views because YouTube cares whether viewers are satisfied, and time spent is one of the clearest signs.
Audience retention graph
The curve shows the share of viewers still watching at each moment. Read it in three parts:
- First 30 seconds: a steep drop means the intro did not confirm what the title promised. Get to the point faster.
- Dips in the middle: a slow section, an off-topic story or a sponsor-like segment. Cut or tighten it next time.
- Spikes: people rewound to watch something again. That moment is valuable; make it a Short or a full video.
YouTube also marks “key moments for audience retention” on some videos, such as intros and top moments, which makes this analysis quicker.
Watch time
Total hours watched. It grows with both views and duration and is a useful channel-level health metric. It also matters for eligibility thresholds of the Partner Programme, if that is one of your goals.
Subscribers gained per video
Which videos convert viewers into subscribers? Often it is not the most-viewed ones but the most specific ones, where the viewer realises you can help with more than one problem.
New and returning viewers
A healthy business channel has both. Only new viewers means you are not building a relationship; only returning ones means you are not reaching new customers.
Traffic sources: how people find your videos
| Source | What it means | What to do more of |
|---|---|---|
| YouTube search | Viewers typed a query and chose your video | Clear, searchable titles; answer specific questions; check the search terms report |
| Suggested videos | Shown next to or after other videos | Videos on the same topic as popular ones in your niche; series and playlists |
| Browse features | Home page and subscriptions feed | Strong thumbnails; regular uploads for your subscribers |
| Shorts feed | Views from swiping through Shorts | Short, vertical clips with a quick hook; link them to a related long video |
| External | Websites, messengers, other social networks | Share videos in your newsletter, chats and posts |
| Channel pages and playlists | Viewers browsing your channel | Organised playlists, a clear channel trailer and featured video |
For small businesses, search and suggested videos usually bring the most valuable viewers, because they arrive with a specific question. Open the YouTube search source in advanced mode to see the actual search terms. That list is a free source of video ideas.
How YouTube Shorts analytics is different
Shorts are measured partly differently, and mixing them with long videos in one table can mislead you.
- Viewed vs swiped away: the share of people who kept watching versus those who swiped past. This is the Shorts version of CTR and the first number to check.
- Views: in 2025 YouTube changed how Shorts views are counted, so that starts and replays count as views, while a separate “engaged views” metric keeps the older logic. Compare Shorts with Shorts, and ideally over the same period.
- Average view duration and loops: a Short watched more than 100% of its length means people rewatched it.
- Subscribers from Shorts: Shorts can bring many views and few subscribers. Check which Shorts actually grow the channel.
Filter the Content tab by Shorts and Videos separately. Channel-wide averages that mix both are rarely useful.
Audience tab: who watches and when
The Audience tab shows age, gender, top countries, languages, when your viewers are on YouTube, and what other channels and videos your audience watches. For a business, two parts are especially practical:
- Geography: a local plumbing company with most viewers abroad needs more local signals in titles and videos: city names, local prices, local problems.
- When your viewers are on YouTube: a heat map of days and hours. Publish shortly before the darkest cells so the video is ready when your audience arrives.
Research tab: ideas from real searches
The Research tab shows what your viewers and YouTube viewers in general search for, including searches where few good videos exist. For a small business this is a ready list of topics. Say a garden design studio sees “small backyard ideas on a budget” there: that is a video with a built-in audience. Save promising terms and build a quarter’s content plan around them.
A monthly YouTube analytics review in 30 minutes
- Overview, last 28 days vs previous: views, watch time, subscribers. Direction matters more than size.
- Top 5 videos by views and by subscribers gained: what do they have in common? Topic, format, length, title style?
- CTR check: which recent videos have CTR well below your channel’s typical value? Test a new thumbnail or title on one of them.
- Retention check: open the retention graph of your latest two videos and note where the first big drop happens.
- Traffic sources: is search growing? Which search terms appeared this month?
- Business result: how many enquiries, bookings or sales mentioned YouTube this month? Ask and count.
- Decisions: one topic to repeat, one edit rule to change, one search term to target next.
| Month | Views | Watch time (h) | Subscribers | Avg CTR | Enquiries from YouTube | Next decisions |
|---|---|---|---|---|---|---|
| Month 1 | ||||||
| Month 2 |
Common mistakes with YouTube analytics
- Judging after 24 hours. Many business videos get most of their views from search over months. Look at 7 and 28 days, and revisit strong topics later.
- Mixing Shorts and long videos in one average. They are different formats with different numbers.
- Chasing CTR with clickbait. A misleading title raises CTR and then crashes retention, which hurts more.
- Ignoring small channels’ noise. With 200 views, a few viewers change percentages a lot. Look for patterns across several videos.
- Measuring only YouTube numbers. Add a tracked link to the description and ask customers where they came from.
YouTube analytics in AI SMM
YouTube Studio is where you diagnose a single video: CTR, retention graph, search terms. AI SMM analytics (Pulse) adds the wider view: subscribers, views and engagement for each YouTube video on the same screen as TikTok, Instagram and your other connected networks, with an AI hint on each tab about what changed and what to try, and an export for client reports. Retention, CTR and watch time stay in YouTube Studio, so use both side by side.
Acting on the review also happens in one place. AI Content Studio drafts titles and descriptions from your script or a brief, which helps when CTR says a title is weak. Video clipping turns a spike on the retention graph into vertical Shorts with subtitles. The content calendar schedules the upload, and comments on your videos arrive in the shared inbox, where AI can draft a reply from your knowledge base before you send it.
FAQ
What is a good CTR on YouTube?
There is no single number. In our experience many small business channels see roughly 2–10%, and it varies by traffic source: search is often higher, home page lower. Compare each video with your own channel’s typical CTR.
How long until YouTube analytics shows data for a new video?
Realtime views appear within minutes, and most metrics fill in within a day or two. For business videos that rely on search, give a video at least 28 days before calling it a success or a failure.
Which matters more: views or watch time?
For a business channel, watch time and average view duration usually say more. They show that people found the video useful, which leads to subscribers and enquiries. Views without watch time rarely bring customers.
Why do my Shorts get views but no subscribers?
Shorts viewers swipe quickly and often do not know who you are. Give them a reason to follow: a series, a clear promise of what the channel covers, and a related long video linked from the Short.
Book 30 minutes at the start of each month, run the review above and leave with three decisions for the next videos. To see YouTube next to all your other networks with AI hints on what to do next, try analytics in AI SMM.
Posts, chats, video and sales in one workspace. 7 days free.
Start free