
 AI SMM team
Social media KPIs and metrics are the numbers that show whether your social media work is moving the business forward. Metrics are everything the networks can count: views, likes, followers, clicks. KPIs (key performance indicators) are the three to five metrics you pick because they are tied to a business goal and you have a target for them. The problem most small businesses have is not a lack of data but too much of it: every network shows dozens of numbers, and it is easy to spend an hour on dashboards and still not know what to do next. This guide sorts the useful metrics by funnel stage, gives a formula for each, and shows how to choose the few that deserve to be KPIs.
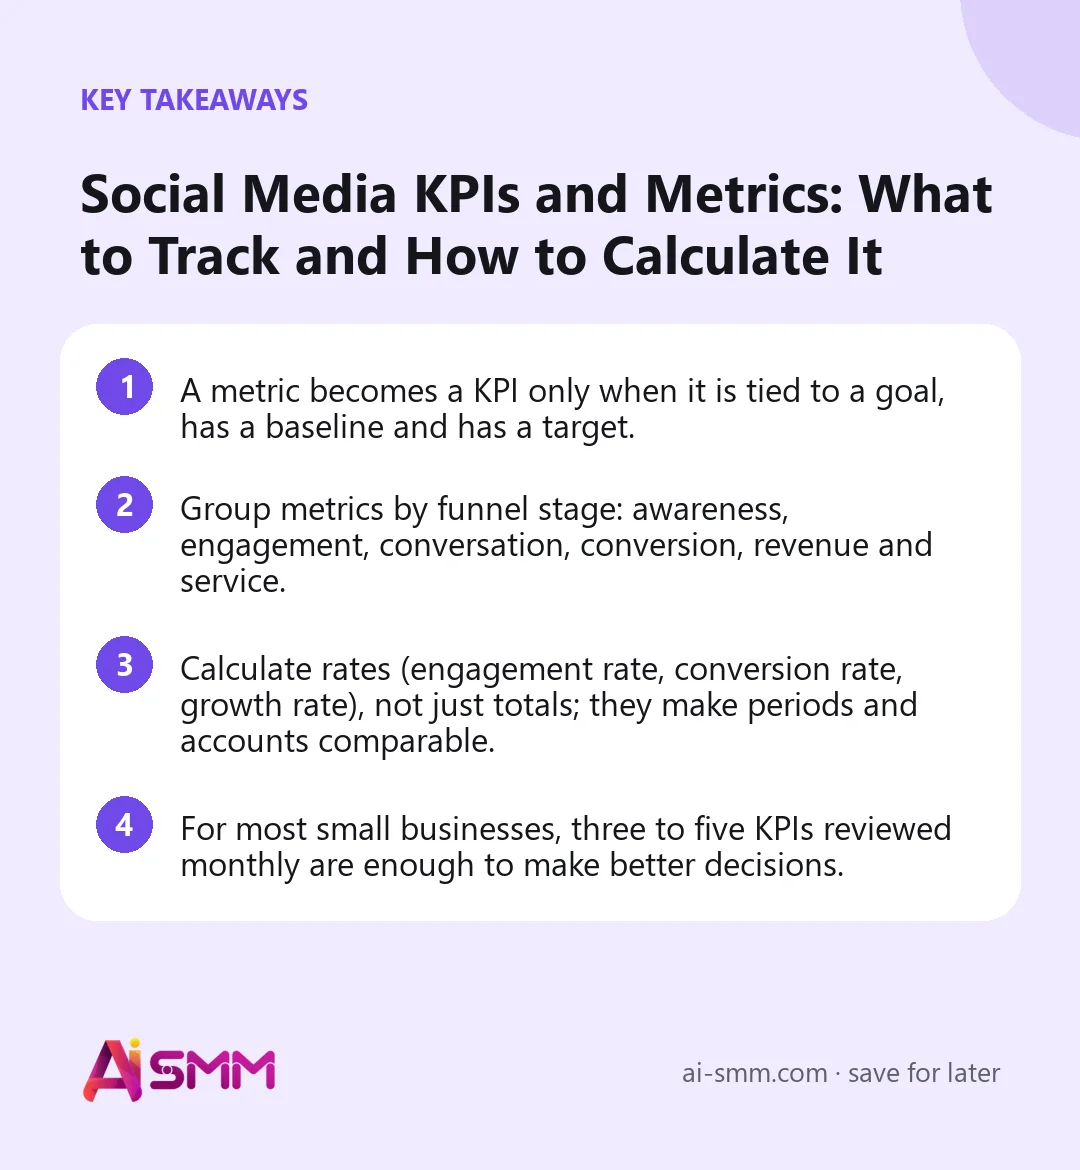
- A metric becomes a KPI only when it is tied to a goal, has a baseline and has a target.
- Group metrics by funnel stage: awareness, engagement, conversation, conversion, revenue and service.
- Calculate rates (engagement rate, conversion rate, growth rate), not just totals; they make periods and accounts comparable.
- For most small businesses, three to five KPIs reviewed monthly are enough to make better decisions.
Metrics vs KPIs: the difference in one table
| Metric | KPI | |
|---|---|---|
| Definition | Any number a network or tool can measure | A metric chosen to track progress toward a specific goal |
| How many | Dozens per network | Three to five for the whole social media effort |
| Has a target? | No | Yes, with a deadline |
| Example | Likes on a Reel | “Bookings from Instagram: from 12 to 25 a month by June” |
| Who looks at it | Whoever runs the account | The owner or manager, at the monthly review |
A good test: if a number goes up or down by 30%, would you change something? If yes, it may be a KPI. If you would just shrug, it is a metric you can check occasionally.
Social media KPIs and metrics by funnel stage
The easiest way to make sense of social media numbers is to line them up along the path a customer takes: first they see you, then they react, then they talk to you, then they buy, then they come back. Each stage has its own metrics.
Awareness metrics: are new people seeing you?
| Metric | What it shows | Formula |
|---|---|---|
| Reach | How many unique accounts saw your content | Counted by the network |
| Impressions / views | How many times content was displayed, including repeats | Counted by the network |
| Reach rate | What share of your followers you actually reach | Reach ÷ followers × 100% |
| Non-follower reach share | How much of your reach is new people | Reach among non-followers ÷ total reach × 100% |
| Follower growth rate | How fast the audience grows, independent of its size | (Followers at end − followers at start) ÷ followers at start × 100% |
| Share of voice | Your share of the conversation in your niche | Your mentions ÷ (your mentions + competitors’ mentions) × 100% |
Reach and impressions are easy to confuse; if you are unsure which one your network shows, the rule of thumb is that reach counts people and impressions count displays.
Engagement metrics: do people care?
| Metric | What it shows | Formula |
|---|---|---|
| Engagement rate by reach | How many of those who saw a post reacted | (Likes + comments + shares + saves) ÷ reach × 100% |
| Engagement rate by followers | How active your audience is overall | (Likes + comments + shares + saves) ÷ followers × 100% |
| Amplification rate | How often people pass your content on | Shares ÷ reach × 100% |
| Save rate | How often content is useful enough to keep | Saves ÷ reach × 100% |
| Comment rate | How often content starts a discussion | Comments ÷ reach × 100% |
| Video retention / average watch time | Whether people watch or scroll away | Counted by the network |
Engagement rate by reach is usually the fairest way to compare posts, because it does not punish a post that reached a lot of new people. Engagement rate by followers is better for comparing accounts of different sizes. Pick one method and use it consistently; mixing them makes month-to-month comparisons meaningless.
Conversation metrics: are people talking to you?
This stage is missing from many KPI lists, yet for small businesses it is often where the sale is decided.
- Conversations started: new DM threads plus keyword comments that led to a chat, per week or month.
- Conversation rate = conversations started ÷ reach × 100%. It shows how well content turns viewers into people who ask.
- Profile actions: taps on the profile, the bio link, the call or directions buttons, where the network reports them.
Conversion metrics: do they take action?
| Metric | Formula |
|---|---|
| Click-through rate (CTR) | Link clicks ÷ impressions × 100% |
| Conversation-to-sale rate | Sales or bookings from chats ÷ conversations started × 100% |
| Conversion rate from social traffic | Orders or sign-ups from social visitors ÷ visitors from social × 100% |
| Leads from social | Count of forms, bookings or contact requests attributed to social |
| Cost per lead (paid) | Ad spend ÷ leads from ads |
Revenue metrics: does it make money?
- Revenue from social: sum of orders or bookings attributed to social channels.
- Average order value from social = revenue from social ÷ number of orders from social.
- Customer acquisition cost (CAC) = total social media cost for the period (time, tools, ads, freelancers) ÷ new customers from social.
- Return on investment (ROI) = (revenue from social − social media cost) ÷ social media cost × 100%.
Service and retention metrics: do they stay happy?
- First response time: median time from a customer’s message to your first reply. Median is more honest than average, because one message answered after a weekend distorts the average.
- Response rate = messages answered ÷ messages received × 100%.
- Resolution rate: share of conversations closed without escalation or a follow-up complaint.
- Sentiment: share of positive, neutral and negative comments and mentions, even if you only estimate it by reading.
- Repeat purchase rate = customers from social who bought again ÷ all customers from social × 100%.
How to choose your 3–5 KPIs
Start from the business goal and walk backwards through the funnel. Pick one KPI for the result and two to four for the stages that lead to it.
| Business goal | Result KPI | Leading KPIs |
|---|---|---|
| More bookings for a local service | Bookings from social per month | Non-follower reach, conversations started, first response time |
| More online sales | Revenue from social | Link CTR, conversion rate from social traffic, save rate on product posts |
| B2B leads | Qualified leads per month | Engagement rate by reach, profile visits, conversation rate |
| Awareness in a new city or niche | Reach among new audiences | Follower growth rate, amplification rate, share of voice |
| Community and retention | Repeat purchase rate | Comment rate, channel subscriber growth, sentiment |
Set a baseline before a target
Take the last three months, calculate each KPI, and use the average as the baseline. Then set a target that is ambitious but plausible, for example 20–50% better within a quarter for a small account. A target without a baseline is a guess; a baseline without a target is just a report.
Know where each number comes from
Before the first review, write down the source of every KPI. Reach and engagement come from network statistics or an analytics tool. Conversations and response time come from your inbox or messenger. Bookings, orders and revenue come from your booking system, store or cash register, ideally with a note of the channel each customer came from. When sources are fixed in advance, the monthly review takes minutes instead of an evening of hunting through apps, and two people calculating the same KPI will get the same answer.
Decide the review rhythm
- Weekly, 10 minutes: glance for anomalies. Did reach collapse? Did DMs go unanswered?
- Monthly, 30 minutes: compare KPIs with baseline and target, find the best and worst posts, pick one change.
- Quarterly, 1 hour: ask whether the KPIs are still the right ones for the current goal.
Network-specific metrics worth knowing
The funnel metrics above work everywhere. On top of them, each network has one or two numbers that say a lot about how its recommendation system treats your content. They make good supporting metrics, rarely good KPIs on their own.
| Network | Metric worth watching | Why it matters |
|---|---|---|
| Shares and saves per post, non-follower reach | Signals that content is worth recommending beyond your followers | |
| TikTok | Average watch time and share of viewers who watch to the end | Short videos live or die by retention in the first seconds |
| YouTube | Impressions click-through rate and average view duration | Shows whether the thumbnail wins the click and the video keeps the viewer |
| Comments per post and profile or page visits | Discussion and follow-up visits matter more than reactions for B2B | |
| Outbound clicks and saves | Pins are a traffic source; clicks to your site are the real outcome | |
| Threads, Bluesky | Replies and reposts | Text-first networks reward conversation |
| Telegram channel | Views per post relative to subscribers, subscriber growth | Shows whether subscribers still read you or the channel is going quiet |
A caution on comparing networks: definitions of views, reach and engagement differ slightly between platforms. Compare each network with itself over time first, and only then look across networks, using rates rather than raw totals.
Vanity metrics: when a number flatters but does not help
Vanity metrics are numbers that look good in a screenshot but do not guide decisions. Total followers, total likes and total impressions are the usual suspects. They are not useless, they are just incomplete. Turn them into useful numbers by adding a rate or a stage:
- Followers → follower growth rate and share of followers who are in your area or niche.
- Likes → engagement rate by reach, with saves and shares weighted as more meaningful.
- Impressions → non-follower reach and the conversations those impressions produced.
Worked example: a monthly KPI sheet for a small bakery
Say a neighborhood bakery sells in-store and takes pre-orders for cakes through Instagram DMs. Its goal: 30 cake pre-orders a month from social, up from about 18. Its KPI sheet for one month could look like this (illustrative numbers):
| KPI | Baseline | This month | Target |
|---|---|---|---|
| Cake pre-orders from social | 18 | 23 | 30 |
| Conversations started (DMs + “CAKE” comments) | 60 | 85 | 100 |
| Conversation-to-order rate | 30% | 27% | 30% |
| Non-follower reach share | 25% | 38% | 40% |
| Median first response time | 3 h | 50 min | under 1 h |
Reading it takes a minute: reach and conversations grew thanks to more Reels, response time improved, but the conversation-to-order rate dipped. The one change for next month is on the chat side, for example sending a price list and available dates in the first reply, not on content.
Common mistakes with social media KPIs
- Too many KPIs: if everything is key, nothing is.
- Only top-of-funnel KPIs: reach and followers with no link to conversations or sales.
- Mixing formulas: engagement rate by followers one month and by reach the next.
- Adding up reach across networks: the same person can be counted on each network, so the total overstates the real audience.
- Judging by one post: look at trends over weeks, not single spikes.
- Ignoring time spent: a KPI that improves only because you doubled your hours is not a free win.
How to track social media KPIs in AI SMM
In AI SMM, Pulse analytics collects followers, reach, engagement and post data from 12 networks, including Instagram, Facebook, Threads, TikTok, YouTube, LinkedIn and Pinterest, onto one screen. You can switch between one account and the whole company, see which posts performed best on the Posts tab, compare yourself with competitor accounts, and read an AI hint on each tab that explains what changed and what to try. Pulse tabs can also be exported for a client or a partner. X and Telegram are not included in AI SMM analytics, so if they matter to your goal, take those numbers from each network’s own statistics.
Conversation and service KPIs come from the inbox, whose reports show response speed, busiest channels and the most frequent questions. Keyword comments that start DMs through chat flows make conversations easy to count, and bookings made through online booking give you a clear result KPI. Agencies that report KPIs to several clients can see how this works on the agencies page.
FAQ
What are the most important social media KPIs?
There is no universal list; it depends on the goal. For most small businesses, a sensible set is non-follower reach, engagement rate by reach, conversations started, bookings or sales from social, and first response time.
How many KPIs should I track?
Three to five. One for the business result and two to four for the steps that lead to it. Keep the rest as metrics you check when something looks off.
Should I calculate engagement rate by reach or by followers?
By reach when comparing posts, by followers when comparing accounts. Whatever you choose, use the same formula every month so the trend is meaningful.
How do I measure KPIs for networks that are not in my analytics tool?
Use the network’s own built-in statistics and copy the few numbers you need into the same monthly sheet. Keep the definitions identical so the networks stay comparable.
If your current reporting is a pile of screenshots, set up your first KPI review in AI SMM analytics and let the AI hint do the first read of the numbers.
Posts, chats, video and sales in one workspace. 7 days free.
Start free