
 AI SMM team
Reach vs impressions comes down to one distinction: reach counts how many different people saw your content, impressions count how many times it was shown in total. If one person sees your post three times, that is a reach of 1 and 3 impressions. The two numbers sit side by side in almost every analytics screen, they move differently, and confusing them leads to wrong conclusions, like celebrating “10,000 impressions” that were really 2,000 people seeing the same ad five times. This guide explains both metrics, the formulas that connect them, how each network labels them, and which one to watch for which goal.
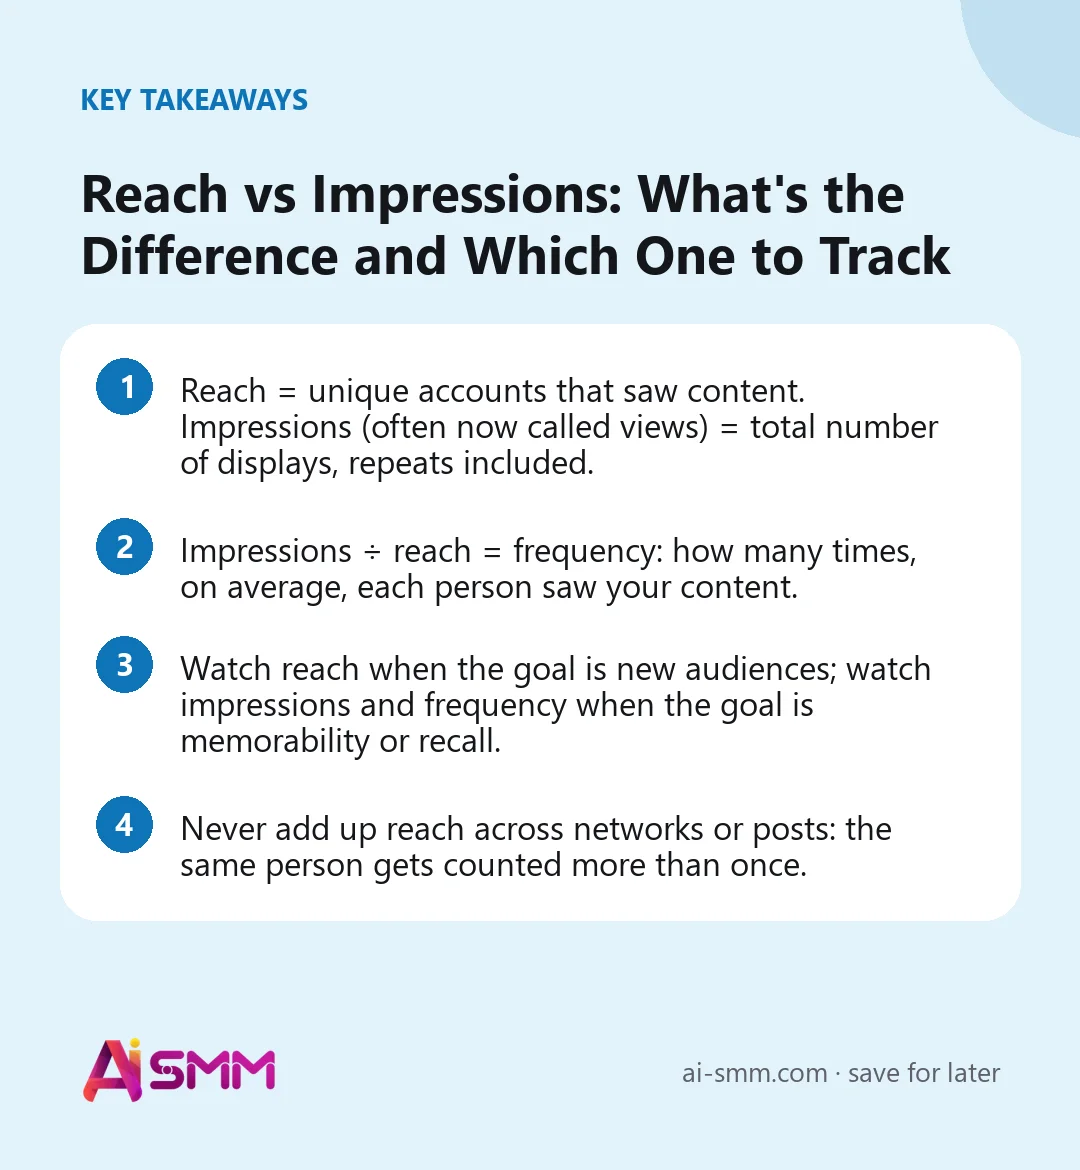
- Reach = unique accounts that saw content. Impressions (often now called views) = total number of displays, repeats included.
- Impressions ÷ reach = frequency: how many times, on average, each person saw your content.
- Watch reach when the goal is new audiences; watch impressions and frequency when the goal is memorability or recall.
- Never add up reach across networks or posts: the same person gets counted more than once.
Reach vs impressions: definitions
What is reach?
Reach is the number of unique accounts that saw a piece of content or your account’s content over a period. Each account is counted once, no matter how many times it saw the post. Reach answers the question “how many people did we get in front of?”
What are impressions?
Impressions are the number of times content was displayed on a screen. Every display counts, including repeat displays to the same person: scrolling past the post twice, seeing it in the feed and again in a share, watching a video that loops. Impressions answer the question “how many times was our content shown?”
A quick example
A cafe posts a Reel about its new breakfast menu. Over three days:
- Anna sees it once in her feed.
- Ben sees it in his feed, then again when a friend sends it to him.
- Chris watches it three times because the video loops while he reads the caption.
Reach = 3 (Anna, Ben, Chris). Impressions = 1 + 2 + 3 = 6. Frequency = 6 ÷ 3 = 2.
Reach vs impressions at a glance
| Reach | Impressions / views | |
|---|---|---|
| Counts | Unique people (accounts) | Total displays, including repeats |
| Always | Less than or equal to impressions | Greater than or equal to reach |
| Grows when | New people discover content | New people discover it or existing viewers see it again |
| Best for | Audience growth, awareness among new people | Recall, repetition, total attention |
| Can you add up across posts? | No, people overlap | Yes, displays simply add up |
| Risk of misreading | Low | High: a big number can hide a small audience |
The formulas that connect reach and impressions
Frequency
Frequency = impressions ÷ reach. It shows how often, on average, each person saw your content. For organic posts, frequency is usually slightly above 1. For ads, it is a number you manage: too low and people forget you, too high and they get tired of you. Many advertisers watch for fatigue once the same people have seen an ad several times in a short period, though the right threshold depends on the offer and the creative.
Reach rate
Reach rate = reach ÷ followers × 100%. It shows what share of your audience you actually reached. It can be above 100% if a post spreads well beyond your followers.
Non-follower reach share
Non-follower reach share = reach among non-followers ÷ total reach × 100%. Where a network splits reach into followers and non-followers, this is one of the most useful growth numbers: it shows whether your content is finding new people or just circling your existing audience.
Engagement rate by reach and by impressions
Engagement rate by reach = interactions ÷ reach × 100%. Engagement rate by impressions = interactions ÷ impressions × 100%. The first tells you what share of people reacted; the second tells you what share of displays led to a reaction. Engagement rate by reach is the more common choice for organic content, while ad reports often use impressions-based rates like CTR.
What the networks call reach and impressions
Networks rename metrics from time to time, and the labels below reflect the general picture rather than a guarantee of the exact wording in your app today. The logic stays the same: one number counts people, another counts displays.
| Network | “People” metric (reach) | “Displays” metric (impressions) |
|---|---|---|
| Accounts reached | Views (Meta has been replacing “impressions” with “views”) | |
| Reach or viewers | Views, formerly impressions | |
| TikTok | Reached audience (in post analytics) | Video views |
| YouTube | Unique viewers | Impressions (thumbnail shown) and views (video watched) |
| Members reached or unique impressions | Impressions | |
| Total audience | Impressions | |
| Threads | Not always shown separately | Views |
| Telegram channels | Not shown per post | Post views counter |
A note on YouTube: there, an “impression” means the thumbnail was shown, and a “view” means someone actually started watching. The ratio between them, impressions click-through rate, tells you how well your thumbnail and title work. It is a different use of the word than on most other networks.
Which one should you track?
Both, but for different questions. Choose the lead metric by your goal.
| Your goal | Lead metric | Why |
|---|---|---|
| Grow the audience, get discovered | Reach, especially non-follower reach | You need new people, not the same ones again |
| Local awareness for a shop or studio | Reach among people in your area | Fifty neighbors matter more than five thousand strangers |
| Launch, promotion, event | Impressions and frequency | People need to see the message several times to act |
| Ad campaign efficiency | Frequency and cost per result | High frequency with falling results signals fatigue |
| Content quality | Engagement rate by reach | Shows what share of people who saw it cared |
| YouTube growth | Impressions CTR and views | Shows whether packaging wins the click |
A note for local businesses
For a shop, salon or cafe, the most valuable reach is reach among people who can physically come in. A post that reaches 3,000 people in your city is usually worth more than one that reaches 30,000 people on another continent. Where a network shows audience location, check it alongside reach. Location tags, local hashtags, mentions of the neighborhood and collaborations with nearby businesses all help concentrate reach where it can turn into visits. If reach grows but bookings do not, look at where that reach comes from before changing anything else.
Why reach drops (and what to do)
A sudden drop in reach is one of the most common worries of small businesses. Before blaming the algorithm, check these causes:
- Posting less often: many networks show less of accounts that go quiet. Keep a steady minimum pace.
- Format shift: if you moved from short video to static images, reach among non-followers often falls, because networks push short video to new audiences more actively.
- Weaker hooks: if people scroll past in the first second, the network shows the post to fewer people.
- Less engagement per post: fewer saves, shares and comments signal lower interest.
- Seasonality: holidays and summer months often change how much time your audience spends online.
- Content that breaks the rules: watermarks from other apps, reposted content or borderline topics can limit distribution on some networks.
How to grow reach vs how to grow impressions
To grow reach (more unique people)
- Publish formats that networks recommend to non-followers, usually short vertical video.
- Make content people want to share or save: checklists, before/after, answers to common questions.
- Collaborate with partners, local businesses or creators to tap into their audiences.
- Use relevant keywords in captions and on-screen text, since social search is increasingly how people discover accounts.
- Repurpose one piece across several networks to reach different groups of people.
To grow impressions (more displays)
- Post consistently so followers see you often.
- Use Stories and channel posts to stay visible between feed posts.
- Pin your strongest post to the top of the profile.
- For ads, extend the flight or raise the budget within the same audience, while watching frequency.
Reach and impressions in organic posts vs ads
The two metrics behave differently depending on whether you pay for distribution.
| Organic content | Paid ads | |
|---|---|---|
| Who decides distribution | The network’s recommendation system | You, through targeting, budget and schedule |
| Typical frequency | Close to 1, higher for loyal followers | Rises over the campaign; you can cap or manage it |
| What to watch | Reach, non-follower reach, engagement rate by reach | Reach, frequency, cost per 1,000 impressions, cost per result |
| Warning sign | Reach falling for several weeks in a row | Frequency rising while clicks and results fall |
For ads, a useful cost metric is CPM (cost per mille) = ad spend ÷ impressions × 1,000. It shows how expensive attention is in your audience. Some advertisers also calculate cost per 1,000 people reached = ad spend ÷ reach × 1,000, which is fairer when frequency is high, because it shows what you actually pay to reach new people rather than to repeat yourself.
How to report reach and impressions to an owner or client
A report that just says “Impressions: 48,300” invites the wrong reaction. A short, structured paragraph is far more useful. A simple template:
- Reach this month: the number, the change against last month, and the share of new people (non-followers).
- Impressions or views: the number and the frequency, so the reader sees whether growth came from new people or repeat viewing.
- Top posts by reach: two or three, with one sentence on why they travelled further.
- What reach turned into: engagement rate by reach, conversations started, bookings or orders.
- Next step: one concrete action for next month, for example “two more short videos a week to raise non-follower reach”.
Report each network separately and avoid a single “total reach” line. If you need a combined number, use impressions, which add up correctly, and label it clearly.
Common mistakes with reach and impressions
- Adding reach across posts or networks and reporting it as “total audience”. People overlap; only impressions add up cleanly.
- Comparing Instagram views with LinkedIn impressions as if they were the same metric. Definitions differ in the details.
- Reporting impressions alone to a client or owner. Without reach, a big number can hide a small, repeatedly shown audience.
- Comparing periods of different length, such as a 31-day month with a 28-day month, without noting it.
- Ignoring who was reached: reach among people who could never buy from you is less valuable than a smaller local reach.
Worked example: reading reach and impressions for a month
Say a small interior design studio compares two months on Instagram (illustrative numbers):
| September | October | |
|---|---|---|
| Reach | 8,000 | 7,500 |
| Views (impressions) | 14,000 | 21,000 |
| Frequency | 1.75 | 2.8 |
| Non-follower reach share | 45% | 28% |
| Consultation requests | 9 | 11 |
At first glance October looks like a great month: views up 50%. But reach fell and the share of new people dropped sharply. What happened: the studio posted many Stories and a carousel that followers revisited, so existing followers saw more content, while short videos, which had been bringing in new people, were paused. Requests rose slightly because warm followers saw the offer more often. The conclusion for November: keep the Stories rhythm, which converts, and bring back two Reels a week to restore reach among new people.
How AI SMM shows reach and impressions
In AI SMM, Pulse analytics puts followers, reach and engagement for 12 networks side by side on one screen, including Instagram, Facebook, TikTok, YouTube, LinkedIn, Pinterest and Threads. An AI hint on every tab explains what changed, for example a drop in reach after a quieter posting week, and what to try next. You can switch between one account and the whole company, and compare your growth and activity with competitor accounts. X and Telegram are not part of AI SMM analytics; for a Telegram channel, use the view counters and statistics built into Telegram.
When reach needs a lift, the fixes live next door: video clipping turns one long video into several short vertical clips, the AI content studio repurposes one text for several networks, and the planner keeps the pace steady. Agencies explaining these numbers to clients can see how reporting works on the agencies page.
FAQ
Is reach or impressions more important?
Neither is more important in general. Reach matters more when you want new people to discover you; impressions and frequency matter more when you need the same people to see a message several times, such as during a launch.
Can reach be higher than impressions?
No. Every person reached saw the content at least once, so impressions are always equal to or higher than reach. If a report shows the opposite, the two numbers probably come from different periods or different sources.
What is a good ratio of impressions to reach?
For organic posts, frequency slightly above 1 is typical. For ads, it depends on the campaign; watch whether results fall as frequency rises, which is a sign of fatigue.
Why do my views keep growing while reach stays flat?
Your existing audience is seeing more content or seeing it repeatedly, but you are not reaching new people. Add formats that networks show to non-followers, like short videos, and content people want to share.
If you want reach and impressions from all your networks on one screen with a plain-language explanation, try AI SMM analytics on the free plan.
Posts, chats, video and sales in one workspace. 7 days free.
Start free