
 AI SMM team
Most small business owners open their social media statistics, see that followers went up by 12 and reach went down by 8%, and close the tab. Nothing changes the following week, because the numbers never turned into a decision. This lesson shows a simple weekly routine in AI SMM analytics: fifteen minutes, one screen for all networks, and a short list of actions at the end.
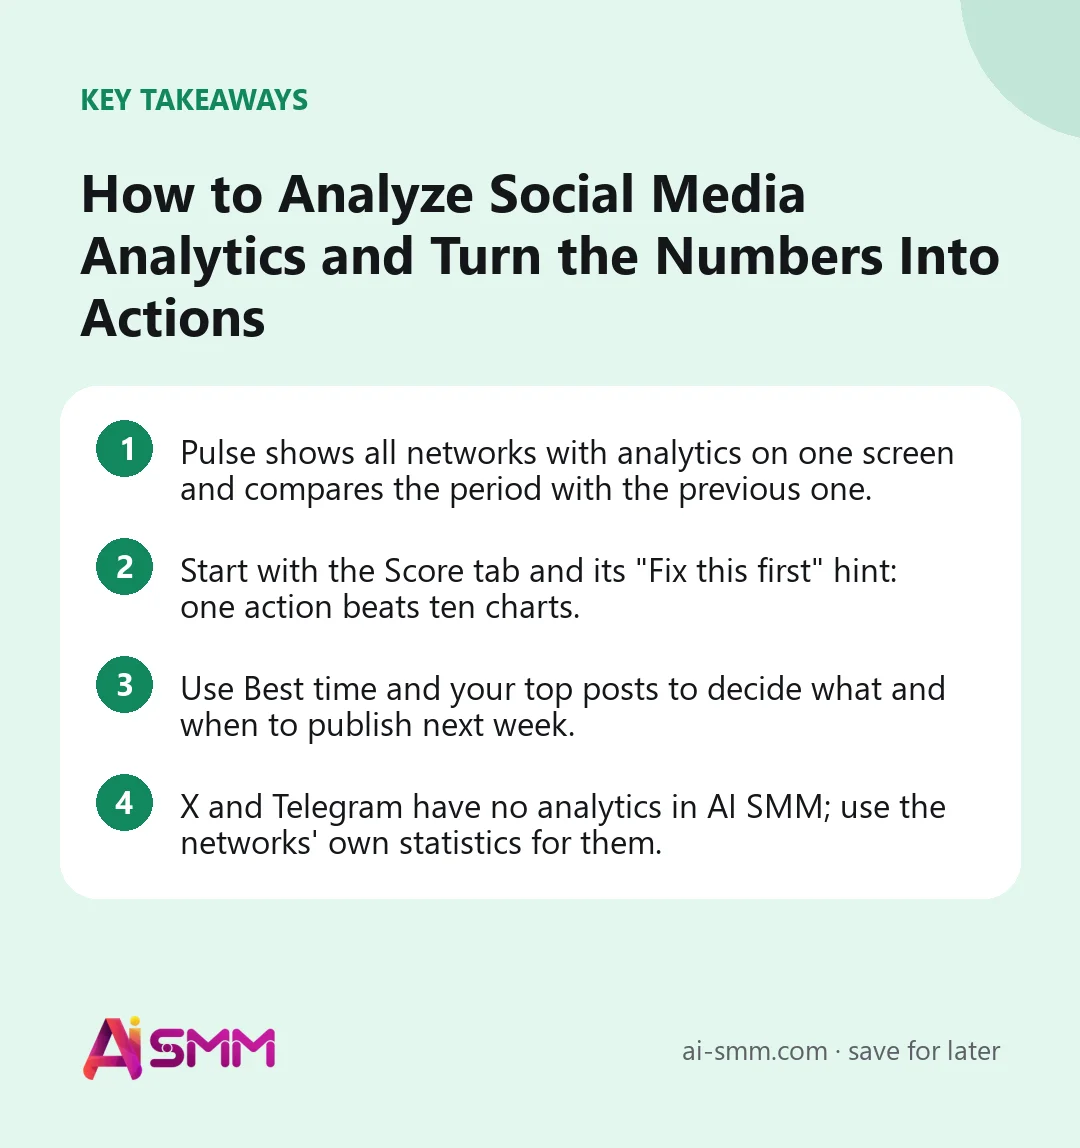
- Pulse shows all networks with analytics on one screen and compares the period with the previous one.
- Start with the Score tab and its “Fix this first” hint: one action beats ten charts.
- Use Best time and your top posts to decide what and when to publish next week.
- X and Telegram have no analytics in AI SMM; use the networks’ own statistics for them.
What you will build in this lesson
A weekly analytics routine that ends with three written actions: what to post more of, when to post it, and one thing to fix. Plus a competitor watch list and a PDF report you can send to a manager or a client.
What you need
- Connected accounts on networks with analytics: Instagram, Facebook, Threads, TikTok, YouTube, LinkedIn, Pinterest, Reddit, Discord, Bluesky, Mastodon or Odnoklassniki.
- A few weeks of posting history. Some views, such as Best time, need about 15 posts before they appear.
- For finding competitors from their website and collecting their commenters: the AI SMM Chrome extension.
X and Telegram have no analytics in AI SMM. You can publish to them as usual, but their numbers will not appear in Pulse; check them in the networks themselves.
Step 1. Open Pulse and set the period
- In the Social media management app, open the Analytics section. It has two items: Pulse, the overview of all networks, and Analytics, reports per account.
- Open Pulse and choose the period: last 7, 30 or 90 days.
- If you run several brands, filter by company or channel group.
Data is updated automatically, so there is nothing to refresh or import.
Step 2. Read the Home tab: the business picture
Home shows followers, reach, engagements, engagement rate and posts against the previous period, compares networks and shows followers gained and lost. Read it in this order:
- Posts. Did you publish as much as last period? A drop in reach often follows a drop in posting.
- Engagement rate rather than likes. It accounts for audience size, so it is fair between a small and a large account.
- Networks side by side. Where does the same effort bring more response?
- Followers gained and lost. A spike in unfollows after a certain post is a signal worth reading.
Under the numbers, the block “AI · what you see and what to watch” explains the picture in two or three sentences. Treat it as a colleague’s first opinion, not a verdict.
Step 3. Score tab: find what to fix first
Score gives each account a number from 0 to 100. It is built from four factors that each run from 0 to 100: engagement (35% of the score), audience growth (25%), regularity (20%) and reach efficiency (20%). Under it, Fix this first tells you where to start. If you want to reason it through yourself, look at which factor is lowest:
| Weak factor | What it usually means | One action for next week |
|---|---|---|
| Regularity | Gaps between posts | Fill empty days in the calendar; set a weekly repeating post |
| Engagement | People see posts but do not react | Add a question or a clear call to action; make more of your top post format |
| Growth | Content reaches existing followers only | Add short videos, collaborations or comment-to-DM offers |
| Reach efficiency | Posts reach a small share of followers | Move posts to the Best time slots; test different first lines |
Pick one action. Doing one thing consistently for a month teaches you more than changing everything at once.
Step 4. Posts and Best time: decide what and when
- Posts ranks your best posts by engagement rate. Look at the top five and write down what they share: format (carousel, Reel, text), topic, first line, time of day.
- Best time is a weekday-by-hour heatmap of when your audience responds, built from your own history; it appears after about 15 posts and gets sharper with more. It also shows the best slot per network.
Now act on it: in the calendar, move next week’s posts into the best slots, and plan two posts in the format that won. The composer’s Suggested windows use the same history.
Step 5. Benchmark and Competitors: get context
Benchmark compares you with the anonymous average of AI SMM workspaces, so you see whether a number is low for you or low for everyone.
To watch competitors:
- Open the Competitors tab.
- Choose the network, type the handle or paste a profile link and click Add competitor.
- Or click Find competitors, paste a competitor’s website and click Find accounts, then choose Track or Hide for each suggestion. This uses the AI SMM assistant in your browser, and nothing is tracked until you confirm.
Competitor posts are collected every six hours. Their best posts appear in Pulse, and AI uses them as a reference when it builds your content plan. With the extension you can also collect the people who comment on competitors, now or as a weekly sweep in the hours you choose; they land in Contacts. If Threads is connected, an extra tab shows Threads conversations worth joining.
Step 6. Per-account reports and PDF
- Open Analytics.
- Choose an account and click View single, or choose two or more accounts of the same network and click View group.
- Set the range: 7, 30 or 90 days.
- Click Export PDF to download a report for a manager or a client.
If an account’s data stops updating, click Reconnect channel on the same page. Details are in Pulse, per-network stats and competitors.
What to do about X and Telegram
X and Telegram have no analytics in AI SMM, and it is better to know that up front than to wonder why a network is missing from Pulse. Three practical options:
- Use the networks’ own statistics. Telegram shows channel statistics to admins of larger channels; X shows post and account statistics in the app. Add a two-minute look at them to your Monday routine.
- Measure the result, not the post. If Telegram is where people write to you, the Inbox Reports show how many conversations came from that channel. Conversations and bookings are closer to money than views anyway.
- Use the same content elsewhere as a test. If an idea wins on Instagram or Threads in Pulse, it is a reasonable bet for your Telegram channel too.
Whatever you choose, write the X and Telegram numbers in the same note as your three weekly actions, so the picture stays in one place.
Worked example: a flower shop’s Monday check
Say a flower shop posts to Instagram, TikTok and a Telegram channel. On Monday morning the owner opens Pulse for the last 30 days. Telegram is not in the picture, so she checks subscriber numbers in Telegram itself.
The Score for Instagram points to regularity: there were two silent weeks in the month. The Posts tab shows that three of the top five posts were short videos of bouquets being assembled. Best time lights up weekday evenings. Her three actions for the week: schedule a “bouquet of the day” video for Tuesday, Thursday and Saturday evenings; set a repeating Friday post with weekend delivery slots; add the two local competitors to the watch list to see what they post before holidays. Next Monday she checks one thing only: did regularity improve.
Common mistakes
- Judging by one day. Always compare the period with the previous one.
- Chasing likes. Engagement rate is fairer, and business results (messages, bookings, orders) matter more than both.
- Ten actions at once. You will not know what worked.
- Copying competitors’ posts. Learn their formats and timing, then say it your way.
- Expecting X and Telegram numbers in Pulse. They are not there; track them in the networks.
How to measure the result
This lesson is itself about measuring, so measure the routine: keep a short note of the three weekly actions and, four weeks later, compare the Score and the Home tab with the month before. If the weak factor moved, keep going; if not, change the action, not the goal. For conversations and leads, look at Reports in the Inbox app as well, since a post that brings DMs can matter more than a post that brings likes. The next lesson shows how to handle those messages.
FAQ
Which networks have analytics in AI SMM?
Instagram, Facebook, Threads, TikTok, YouTube, LinkedIn, Pinterest, Reddit, Discord, Bluesky, Mastodon and Odnoklassniki. X and Telegram do not.
Why is the Best time tab empty?
It needs about 15 posts of history to show a reliable pattern.
Can I send a report to a client?
Yes. Open Analytics, choose the account or a group of accounts and click Export PDF. You can also get a statistics digest in Telegram through Telegram notifications.
Where do competitors’ numbers come from?
From their public accounts. Their posts are collected every six hours; a newly added competitor appears at the next collection.
Next lesson: answer every DM and comment from one inbox with your team. Until then, open Pulse and write down your three actions for this week. For the content side, see the publishing calendar.
Posts, chats, video and sales in one workspace. 7 days free.
Start free